The MEEP project is a platform to test new architectural ideas and in order to allow a multi-level development of these ideas, different tools are used to test them. In an earlier stage, the MEEP team uses simulation as a mechanism to exercise and explore different ideas without excessive modelling effort. The tool used by MEEP, denoted ‘Coyote,’ was presented in a previous article as an execution-driven simulation tool, which is focused on data movement throughout the memory hierarchy. This article introduces the main road of the above-mentioned data movement in the memory hierarchy.
NoCs as a communication mechanism in ACME architecture
Nowadays, in the multi-core era, a scalable low-latency and high-throughput communication fabric to connect the cores of the ‘ACME’ accelerator is critical. Buses and crossbars are the dominant fabric in chips with a low number of cores but, due to the limitations in bandwidth on the former and in scalability on the latter, networks on chip (NoC from now on) are the perfect replacement for those typical fabrics in many-core chips like ‘ACME.’
As you can see in the following picture, the NoC interconnects all the tiles (Memory and VAS) of ‘ACME’ using a mesh topology. Each router connects with the others in its cardinal points and a port is connected to the internals of the tile. The links between the routers could be one logical link with a certain width (the physical number of links) or multiple logical links with a different width each one. These multiple networks are used to prevent the protocol deadlock problem [1]. For example, a request of a cache line is a small control message but the cache line is a big chunk of information like 64 bytes. For this reason, the physical link width can be different if different physical networks as subnetworks on the NoC are used.
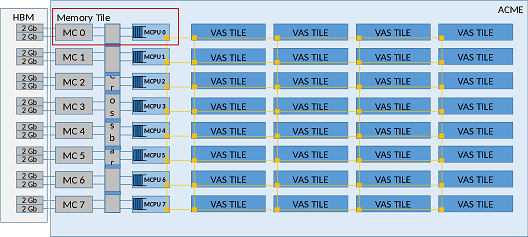
Briefly, a NoC consists of routers, links, and processing elements. In the previous image, you can see the already referenced routers and links, and the processing element (PE) can be defined as the data generator (or injector) in each tile. For example, in a memory subsystem with three levels of cache and a private second level, when a miss in the L2 of one VAS tile happens, the processing element of this tile injects a data request message to a certain memory controller (in the Memory tiles). The reply is injected by the PE in the memory tile and received in the VAS tile. All these messages travel through the NoC hop by hop between the source and destination router.
NoCs models in Coyote
The communication fabric between the tiles in ‘ACME’ should be modelled to be able to analyze the communication requirements imposed by the memory subsystem and by other pieces of the architecture.
At this first stage of the evaluation, the main focus is to identify the bandwidth and latency requirements of the ‘ACME’ architecture based on representative benchmarks. Our objective is to be able to model different NoC implementations and execute the benchmark applications to evaluate if those NoCs satisfy the performance requirements and fit in ‘ACME.’ Basically, different NoC implementations will be evaluated and it will be checked whether the NoC is the bottleneck of the system and therefore, proposing model changes to improve it.
The way a NoC is modelled depends on the required level of detail. Ideally, a NoC is an element that allows the interconnection between different elements with a certain delay. This can be complicated up to the point where developers are able to simulate, cycle-by-cycle, all the steps in the pipeline of the NoC routers.
Depending on the flexibility and the level of detail of the model different metrics can be obtained; like average and tail packet latency, average throughput, average hops per router, etc. All these metrics can be extracted under different configuration situations. For example, the architecture can be tested without any type of congestion and contention or contemplating those aspects, or even testing different topologies.
In order to be able to trade-off the level of detail and the performance of the simulator three different models are taken into account: functional, descriptive, and detailed.
Functional Model
The functional model allows fast simulation and exemplifies an ideal NoC with a fixed delay in its communications. This delay in the first stage is determined based on the current literature. However, in a later stage, it will be obtained from the data provided from the detailed model.
This functional model intends to satisfy the need for NoC simplicity, equal to a low simulation penalty when different aspects of the architecture that are not related to the NoC are tested. Additionally, this allows a latency sweep to analyse the impact of NoC latency over the execution time of several benchmarks.
Descriptive Model
The descriptive model allows to analyse the impact of the location of the MCPUs, in terms of average hop count, and to extract source and destination heat-maps.
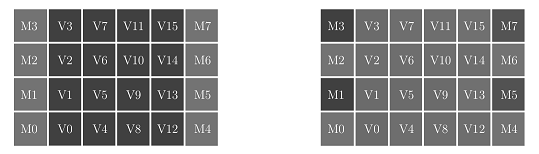
This model mimics the behaviour of a non-fault-tolerant mesh and returns the average hop count of the traffic generated by the executed benchmark. Additionally, it writes a file every certain number of simulation cycles, with a matrix indicating the number of packets sent or received by each element on the network. The figures below show a representation of two such files as a heatmap for a simulation using 16 VAS Tiles and 8 Memory tiles. A darker shade represents that more packets have been sent to a particular tile. Memory tiles are placed in the first and last columns. Both examples were obtained running the same application and overall system configuration but differ regarding the cache sharing policy. On the left, the L2 cache is fully shared across all the tiles forming a NUCA [2]. On the right, cores can only access the L2 located in their tile. As shown by the figure, this change produces significantly different behaviors, concentrating most of the traffic in the VAS tiles in the NUCA case, as opposed to private L2s, which put more stress on the memory tiles.
Detailed Model
This model intends to integrate the well-known Booksim 2 [3] interconnection network simulator into ‘Coyote.’ This integration potentially allows developers to test different topologies, routing policies, and router microarchitectures in order to analyse the impact of contention and congestion, and to provide an accurate average packet latency to be used in the functional model explained before.
This model imposes a certain simulation speed penalty over base simulations but allows a fine-tuning of the proposed architecture regarding the NoC. Therefore, a big insight about the NoC performance and other metrics is achieved. For example, one of the metrics obtained with this model is the average packet latency based on the actual NoC evaluated. Once this metric is obtained for certain simulation experiments, that value can be used to run similar experiments evaluating other aspects of the architecture, which do not impact the NoC, with the functional model much faster.
References
[1] T.M Pinkston: Deadlock characterization and resolution in interconnection networks. Deadlock Resolution in Computer-Integrated Systems pp. 445–492 (2004)
[2] C. Kim, D. Burger, S. W. Keckler: An adaptive, non-uniform cache structure for wire-delay dominated on-chip caches pp. 211–222 (2002)
[3] BookSim Interconnection Network Simulator (Jun 2014), https://github.com/booksim/booksim2
Next steps in the near future?
A first version of the detailed model has already been implemented, which will be refined to more closely match ACME, while an initial evaluation of some initial aspects of the architecture is performed in parallel.
The first experiment could be an evaluation of the offered pressure to NoC based on the type of application used, or more specifically, the way of implementing the application: in a scalar or vector fashion. Another basic experiment could be analyzing the impact of the average NoC latency on the executed applications. The results could respond to the question of what the greatest latency that can be hidden is. The first proposed model is focused on these types of evaluations.
As a second-term experiment, the impact of the architectural placement of Memory Tiles on average NoC latency will be evaluated. This experiment can be carried out with the descriptive model. Other experiments could be related to different aspects of the cache, like the data mapping policies or the sharing mode of the L2; distributed among the VAS tiles or private.
Find more information about MEEP’s ecosystem here and learn more about Coyote here.